


Sprott Physical Gold/Silver Trust
- Oct 20, 2023
- 1 min read
Our Chart of the Day is intended to be a standalone technical chart. We use them to highlight open positions, stocks on our watch list, or indicators that we believe are important, or just interesting at the time. It is not a directional market call. Feel free to share them with others who may be interested.
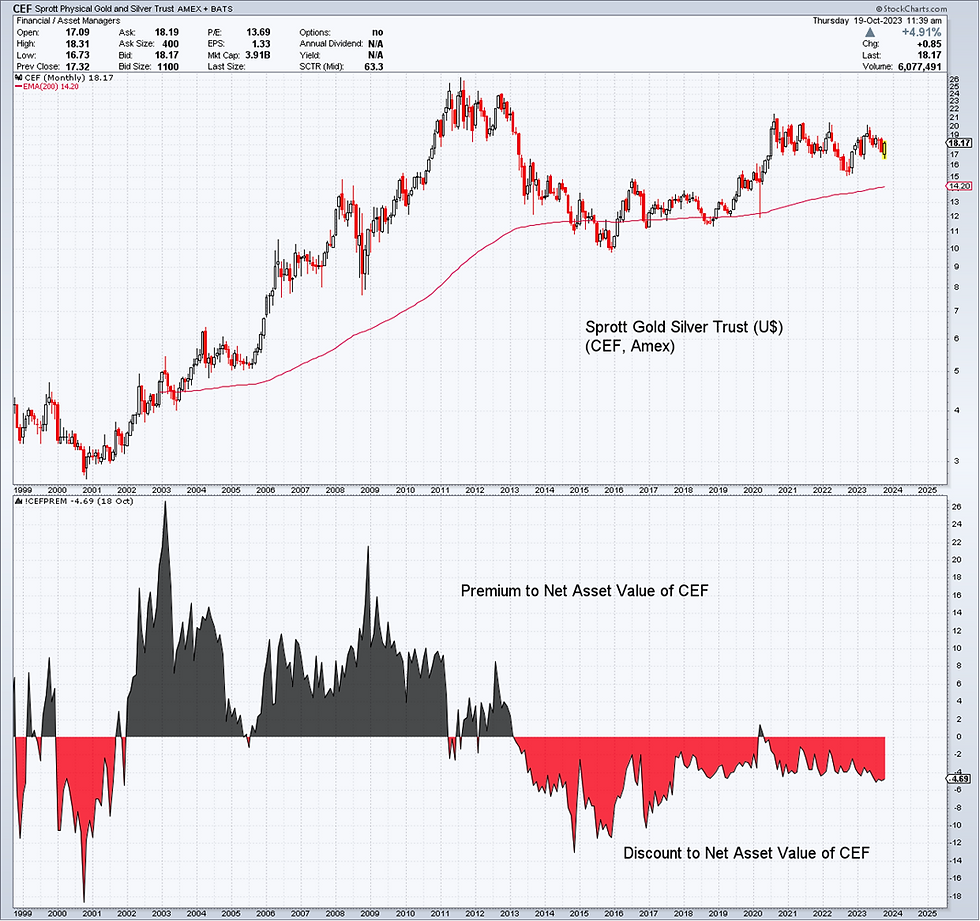
Today's chart shows the US$ version of the Sprott Physical Gold/Silver Trust (CEF) but we hold the C$ version. I use this chart because, with it, I can show the Discount (or Premium) that this closed end fund trades at w.r.t. its Net Asset Value. Note how during the 2003-2011 runup, people were paying over 20% above the Net Asset Value of this trust to get in. Most buyers at that time were unaware they were overpaying, but it demonstrates what can happen when human emotions take over, which they always do. Today, CEF continues to trade at a 4.69% Discount to its NAV.
Total US Debt is now $33.649 Trillion, up $58 billion in one day and up $604 billion in one month... up $833 million every hour. At this rate US debt will be $41 trillion in one year.
US Interest expense heading towards $1 Trillion.
As foreign governments sell off US treasuries and yields hit new highs, it reinforces my view that before this is over, say 1-3 years, people will again be buying gold/silver with both hands and CEF will be trading at a Premium to NAV.


Comments