


S&P500 Levels (Using the S&P500 ETF, SPY, NYSE)
- Oct 13, 2023
- 1 min read
Our Chart of the Day is intended to be a standalone technical chart. We use them to highlight open positions, stocks on our watch list, or indicators that we believe are important, or just interesting at the time. It is not a directional market call. Feel free to share them with others who may be interested.
Green shoots popped up since last Friday's rally, but the weight of the evidence remains bearish for stocks. SPY and QQQ are in downtrends the last two months, but they are getting oversold bounces after becoming oversold last week.
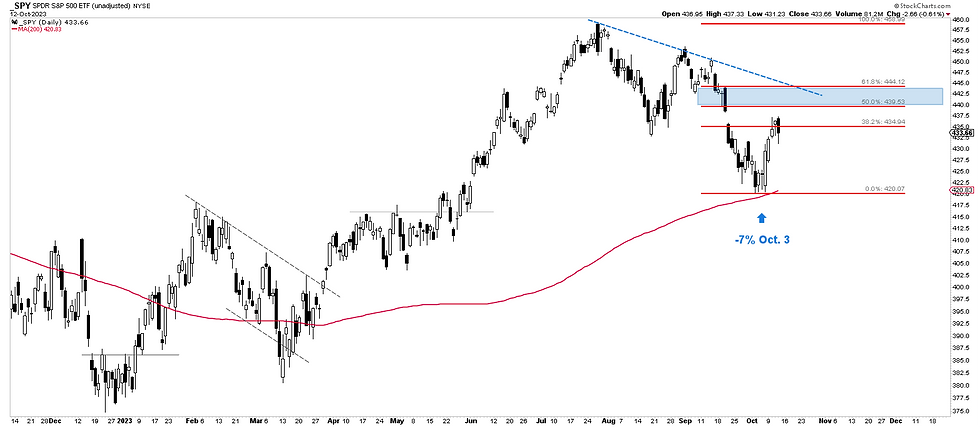
The S&P 500 SPDR (SPY) is getting an oversold bounce within a larger downtrend. The overall trend is down with the lower high from July to August and the lower low from August to September. SPY was oversold after a 7% decline into October 3rd, and the ETF is up 2% in the last six days. Thus, an oversold bounce is underway and I am now marking possible resistance. Broken support turns resistance around 442 and a 61.8% retracement of the 7% decline would extend to 442. Thus, the resistance zone for this bounce is set in the 440-442 area.
A break of that level would likely accompany an upgrade to our Primary Trend Indicator to Neutral or Bullish.


Comments