


PTI and Open Positions - November 17, 2023
- Nov 17, 2023
- 1 min read
Updated: Dec 11, 2023
Weight of Evidence: Remains Neutral but Improving:
Our current Primary Trend Indicator and supporting breadth models remain on neutral. For example, fewer than 50% of the S&P500 stocks are above the 200 Day Moving Average which means there are still large pocks of weakness within the market.
However, almost all of the inputs to these models are improving and close to turning bullish.
Below we see 3.5 year weekly charts of the Nasdaq 100, S&P500, Microsoft and Apple, which constitute ~ 25% of the Core Growth Fund.
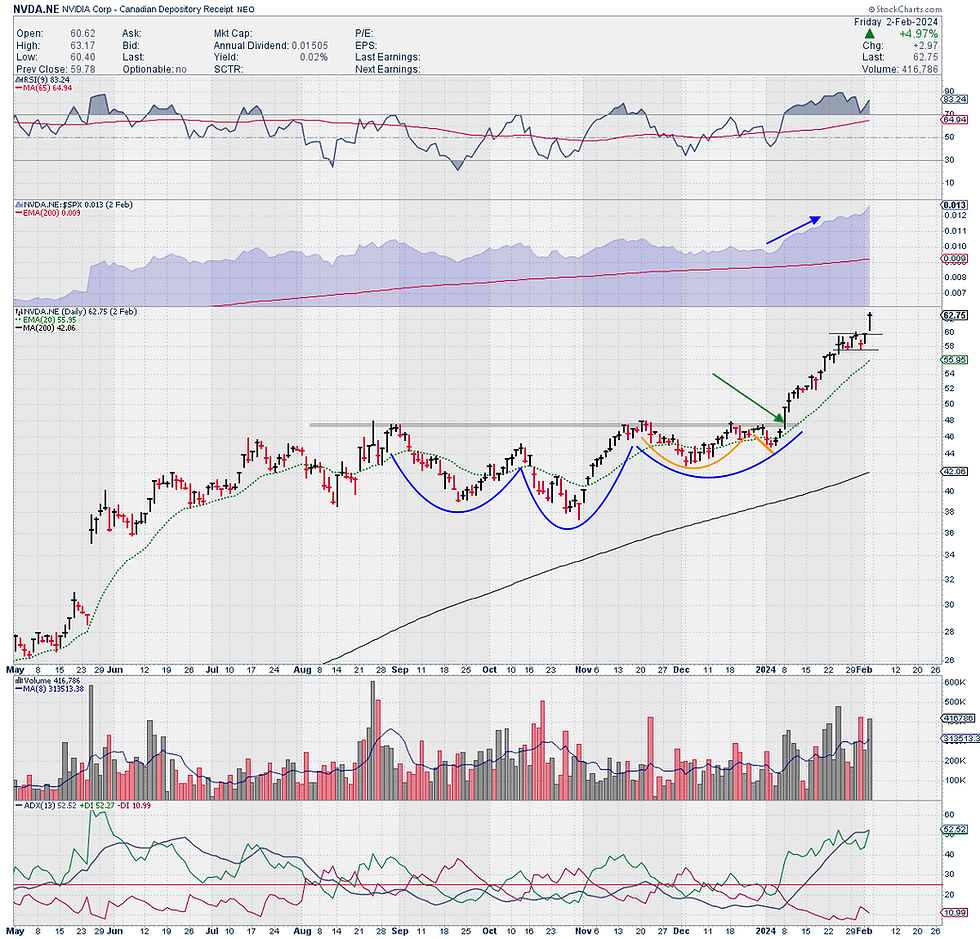
All have broken out of a Cup and Handle pattern which I often mention in these notes. A cup and handle is considered a bullish signal extending an uptrend, and it is used to spot opportunities to go long.
In the short term, these markets are stretched, but if breadth inputs improve further, the upside into year-end could surprise us.
Anything is possible, and we'll keep an open mind.

Our Chart of the Day is intended to be a standalone technical chart. We use them to highlight open positions, stocks on our watch list, or indicators that we believe are important, or just interesting at the time. It is not a directional market call. Feel free to share them with others who may be interested.


Comments