


Market Levels: Happy New Year: (01/03/24)
- Jan 3, 2024
- 1 min read
Updated: Jan 8, 2024
Nasdaq Levels: 01/04/24
When markets come under pressure, we refer to our list of economic, market health and trend indicators. This includes a basic observation of the chart in question. Like Yogi Berra once said, you can observe a lot just by watching.
To start this year, the Nasdaq Composite index, as an observation of market risk appetite, is starting to look like a change of character is happening.
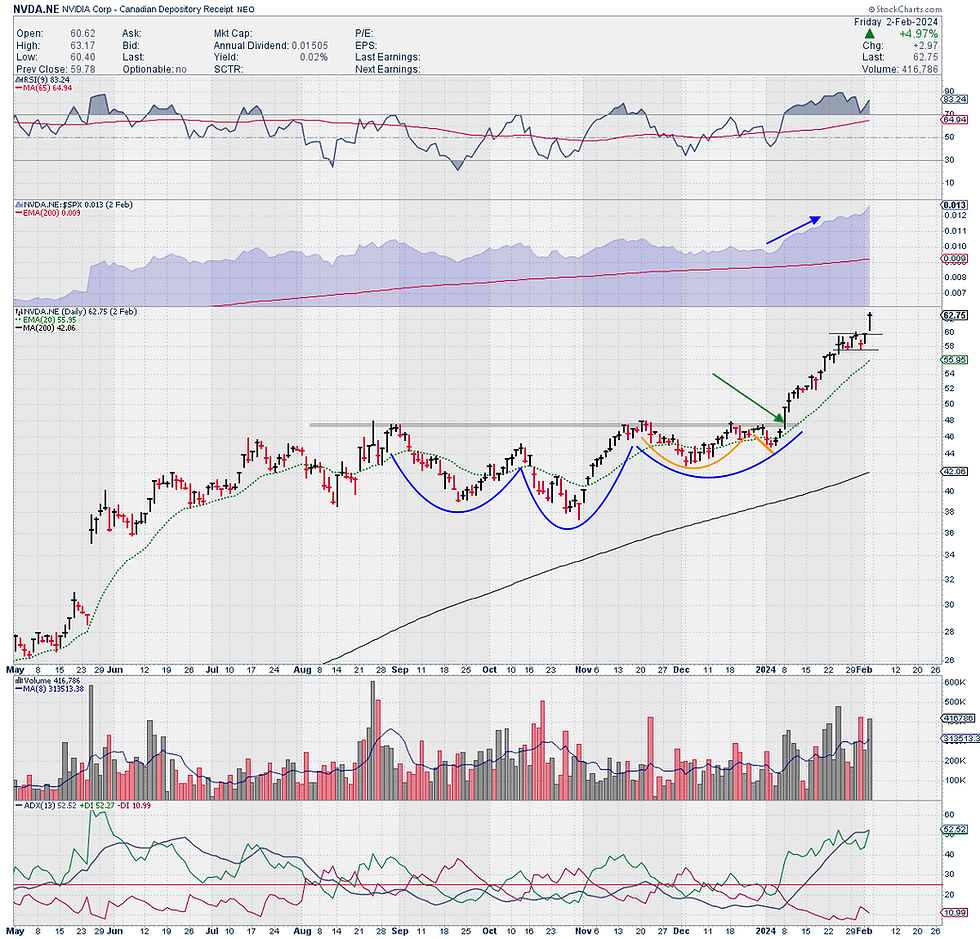
Through the July to October 2023 decline, when the Negative Directional Movement Indicator (-DMI, red line bottom pane) crossed above the + DMI (green line), it was followed by more selling.
Still, the first few days of the new year tend to be rocky. For example, the first session of 2021, on 1/4/21, was a 400-point range top to bottom but the week ended 700 points higher from the intraday low on 1/4.
Credit markets remain solid and our PTI still positive. Day by day.

Our Chart of the Day is intended to be a standalone technical chart.
We use them to highlight open positions, stocks on our watch list, or indicators that we believe are important, or just interesting at the time.
It is not a directional market call.
Feel free to share them with others who may be interested.


Comments