


Market Levels and the Follow Through Day - November 2, 2023
- Nov 2, 2023
- 2 min read
Updated: Dec 21, 2023
Market Levels and the FTD
November is *historically the best month of the year for the S&P 500 Index (SPX), with an average monthly gain of 1.7% (from January 1950-April 2023).
With that being said, we do not invest exclusively based on seasonality.
We believe that the current chart is always the best guide. Also, this is not a typical market environment.
We use technical price data, moving averages and select momentum indicators to make our buy and sell decisions.
After 3 months lower in the (SPX) and going into a seasonally stronger period, we do want to stay on watch for potential reversal signs and/or buy signals. Yesterday, though all of my trend risk models including our PTI are on bear market mode, we got a serious early trend change signal, the Follow Through Day.
The Follow Through Day (FTD)
The FTD system was developed by William J. O'Neil to identify an important change in general market direction from a definite downtrend to a new uptrend.
A follow-through day occurs during a market correction when a major index closes significantly higher than the previous day, and in greater volume. But it needs to happen on Day 4 or later of an attempted rally. The first 2-3 days of a rally is often just short covering by traders. If you see big money drive the market strongly higher, on day 4 or later, it usually means institutions are coming back in. That’s where we want to be, following the big money. The rally attempt continues intact as long as the index doesn't make a new low. Go back in history, and you will find a follow-through day early in every major market uptrend.
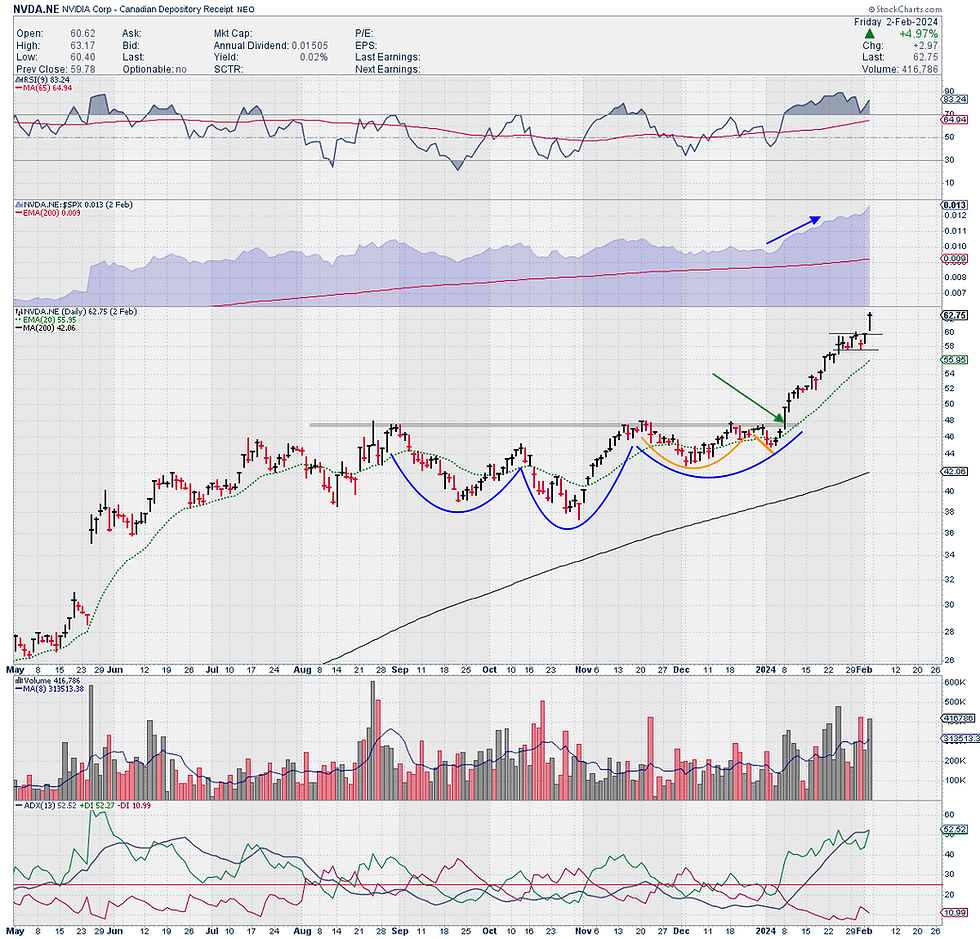
Still, I remain skeptical of this rally, and consider it a bear market rally until at least the S&P500 downtrend line and the 50 Day Trend (blue line) in the chart below are recovered.
Most normal Canadians do not need to concern themselves with these points. But we commit to managing risk and for those following along, this is how we do it. A new uptrend will eventually resume for the broad market; maybe it already has, but in the meantime, we can enjoy the ongoing uptrends in most industries in the energy sector.

Our Chart of the Day is intended to be a standalone technical chart. We use them to highlight open positions, stocks on our watch list, or indicators that we believe are important, or just interesting at the time. It is not a directional market call. Feel free to share them with others who may be interested.


Comments