


Fiscal Dominance (November 2023)
- Nov 1, 2023
- 2 min read
What is Monetary Policy?
Monetary policy is a way the government manages the amount of money circulating in the economy to influence things like inflation and economic growth. They do this by changing interest rates and the amount of money banks have, which can affect how much people and businesses can borrow and spend.
M2 is a measure of money supply that includes all the cash you can quickly access (like in your wallet or checking account) plus savings accounts, time deposits, and certain mutual funds.
The basic law of economics, like an immutable law of nature, is that the more supply of something, the less it is worth. This is the very definition of inflation.
Chart 1. This is a ten-year chart of M2 in Canada

Fiscal Policy Dominates Monetary Policy
As a matter of arithmetic, the trends of government debt and deficits will eventually result in an outrageously high government debt-to-GDP ratio. We are already there.
History shows the possibility that accumulating government debt and deficits can produce increases in inflation that "dominate" central bank (Monetary Policy) stated intentions to keep inflation low.
Summary:
As a government’s fiscal situation worsens, deficits expand (resulting in chart 2) and frequently the government will resort to money printing to fill the gap (Loosely: Chart 1), leading to accelerating inflation and a weakening currency. Even if the government in question tries austerity, the budget deficit expands so rapidly, usually due to shrinking tax receipts, that investors still panic.
Since 2020, the US has printed about the same money as a percent of GDP as has Argentina. Canada is not far off. Argentina now has roughly 100% inflation and 120% interest rates. When you spend money like an emerging market, should you be surprised if your economy begins to reflect a similar outcome? Don't expect the price of avocados or a loaf of bread to drop back to 2020 levels any time soon.
If this continues along this path, it will have direct implications for retirees purchasing power, and the best asset allocation in their portfolios.
Chart 2. This is a ten-year chart of Canadian Government Debt

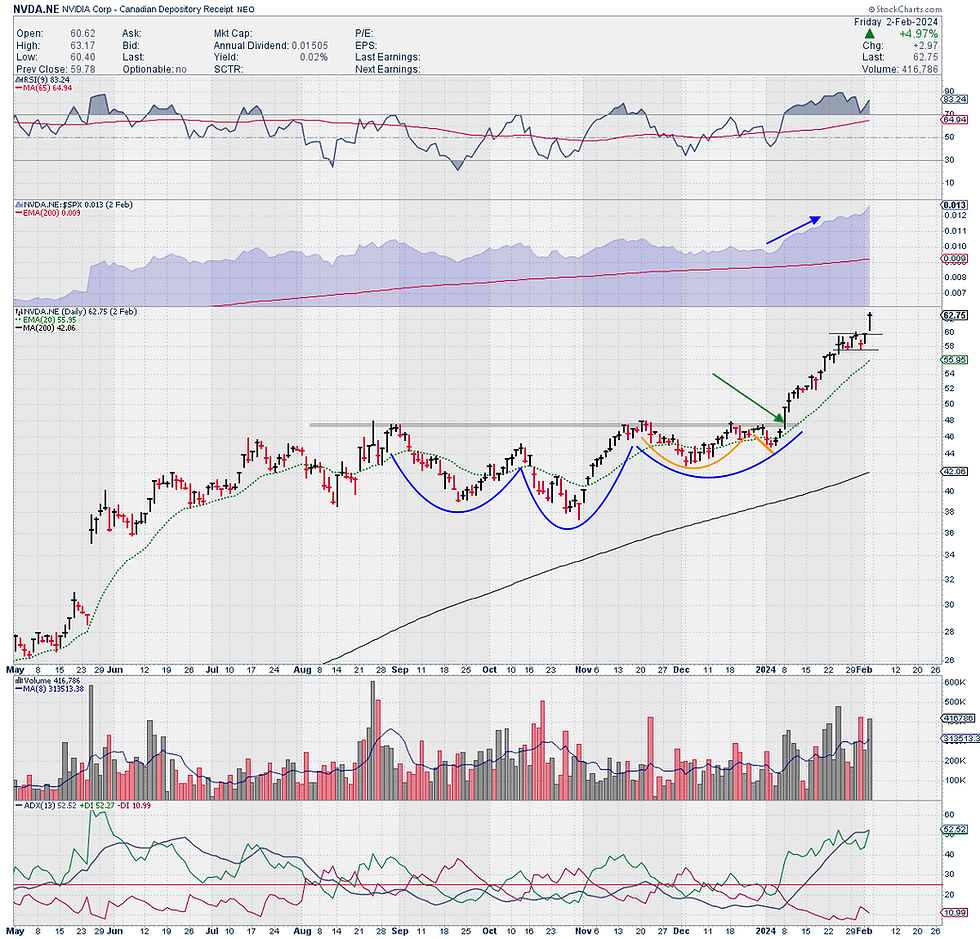
Our Chart of the Day is intended to be a standalone technical chart. We use them to highlight open positions, stocks on our watch list, or indicators that we believe are important, or just interesting at the time. It is not a directional market call. Feel free to share them with others who may be interested.


Comments